The Data
The data is obtained through GitHub’s Rest API using bearer tokens. GitHub’s API has strict rate limits when not using authorisation credentials of some sort. A few of the paginated calls would not be possible on the larger repositories without using supplying credentials.
Three parameters are required being:
- Bearer Token
- Organisation
- Repository
A bearer token can be created through the admin setting on your GitHub login. The token only needs a scope to read repositories.
Any public repository can be used and statistic and insights gained.
The power query is using paginated API calls. BY default GitHub returns page information in the metadata / API response headers. Function loops are created to request more pages until all required data is obtained.
As the API endpoints are dynamic, extra logic is used to allow this work in the Power BI Service and get past the service dynamic data sources limitation.
There is no way for an end user to pass down a power query parameter in a simple embedded report, so the repository cannot be changed on the live version currently. For demo purposes the repository used is Apache Hop which is an open source data integration platform ETL solution.
The Reports
The file consists of three main reports:
- Repository Statistics
- Contributor Statistics
- Pull Requests
Each report has options to change the reporting periods and visuals.
The Repository Statistics report displays commits (over prior 12 months and all time) and code additions / deletions (over prior 12 months and all time)
The Contributor Statistics report displays contributor commits, code additions / deletions and other statistics over varying periods of time (Month to Date, Year to Date, All Time) including previous periods and percentages. The visual change depending on the period selected.
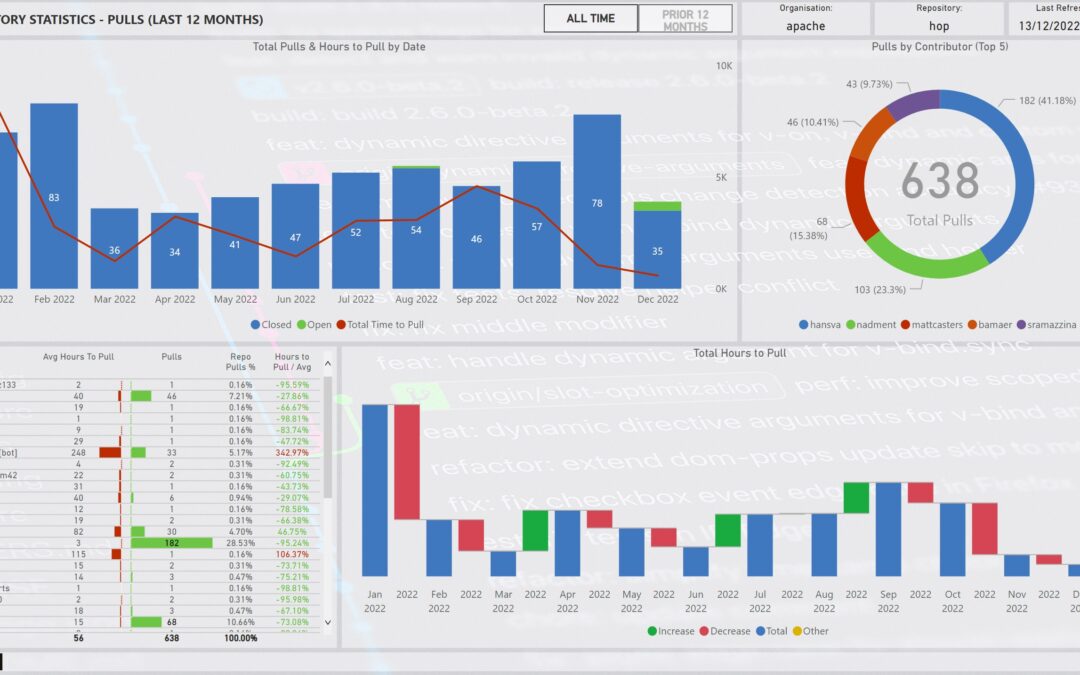
The Pull Requests report displays all the statistics on pulls over different selected periods (All Time, Prior 12 Months).
Check out the live version Here
Recent Comments