The Data
I decided I would like to create some reports based on data provided by Data.Police.UK
There are many ways to obtain data from this site including CSV archives and API calls. For this project I just selected the full date range data dump option of three years. I selected all available police forces (England, Wales, Northern Ireland which includes the crime data, outcomes, and stop and search data category.
This data dump is a 1.5Gb zip file which when extracted is over 4,500 CSV files totalling around 7Gbs. The structure of the extraction is 36 folders (one folder for each month, over the three year period). Within each folder is approximately 125 CSV files. One CSV file for each police force for each month for each of three separate categories.
I created a Python script to sort and combine the data into three main files which can then be used to populate a SQL database for consumption by Power BI.

The Reports
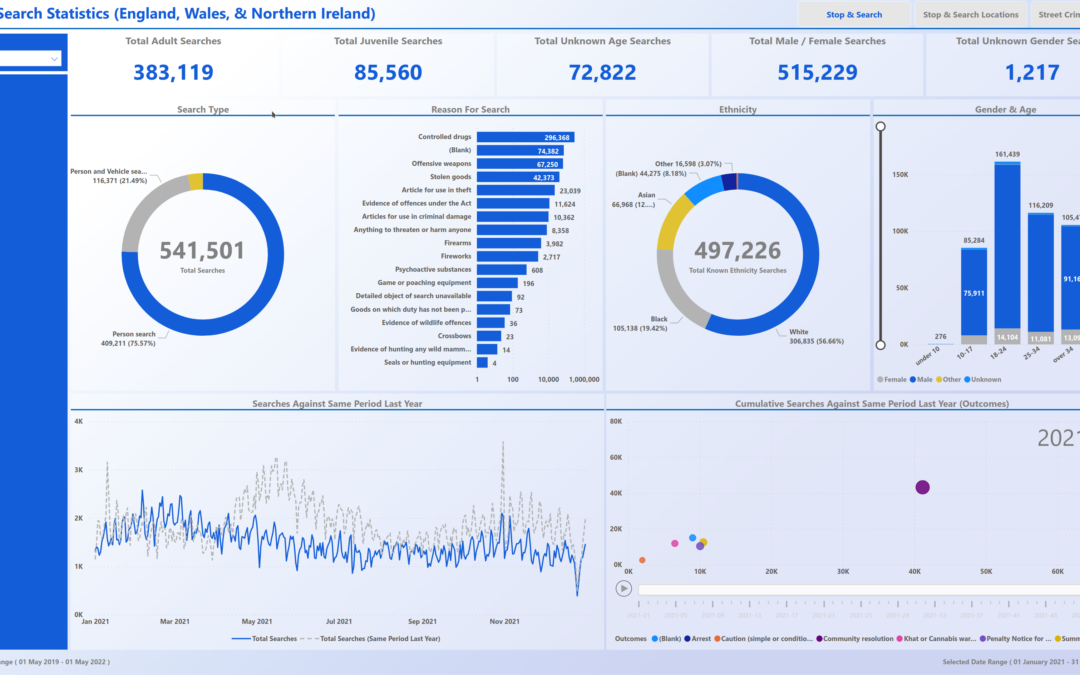
The first and second reports visualise stop & search statistics by years, gender, age, and ethnicity. Additional graphs display the type of search, reason for search, search outcome, yearly comparisons, locations, and detailed trends
The third report is built differently and it can be used to compare crime, population and police forces between different areas and times. For this I required more data to do with populations and police force sizes that was not part of my original sourced data.
On obtaining the extra data and loading it into my model I created disconnected tables to allow the user to pick a primary year and area and comparing year and area. The report then would return the difference in crimes and crime stats between those years and areas. With the additional data, real comparison to whether crime is more or less in the selected periods/areas by using DAX measures on the police force size and population data against the crime data.
I hope you find it interesting.
Check out the live version Here
Great report.
I am trying to use API to get the data but I have no idea how to use Police API call to get the to my power bi!
Can you help please?
Thanks